



Agriculture · LiDAR
LiDAR on a 200-hectare banana plantation: what the drone brings to agriculture
On 200 hectares of banana plantation in Kouzounkpa (Benin), a single drone pass delivered a complete reading of the site — water, ground, canopy. Jargon-free field report on the Agro Kue Kue mission.
- Publication date
- 26 May 2026
- Reading time
- 7 min
On 200 hectares of banana plantation in Kouzounkpa (Benin), a single drone pass delivered what no ground team could have produced in a full season: a complete reading of the site — water, ground, canopy, and every standout tree. Here is what an airborne LiDAR survey actually brings to a plantation, without the jargon.
Why a banana plantation needs more than tree counting
On a banana plantation, production isn't decided by the number of plants. It's decided by soil and water. A well-drained, well-fed plot easily outperforms a denser but poorly supplied one. To steer an operation, the right question isn't how many trees there are — it's what the site that carries them really looks like.
The client brief came down to three questions, in this order:
- How does water move across the site during the rainy season? Where does it accumulate, where does it drain?
- What is the actual topography beneath the canopy, so we can size an irrigation network?
- Which standout trees remain on the site, and at what height?
Three questions, one technical answer: an airborne LiDAR survey. Not a single-shot measurement, but a continuous reading of the site, delivered in five layers that combine in any GIS.
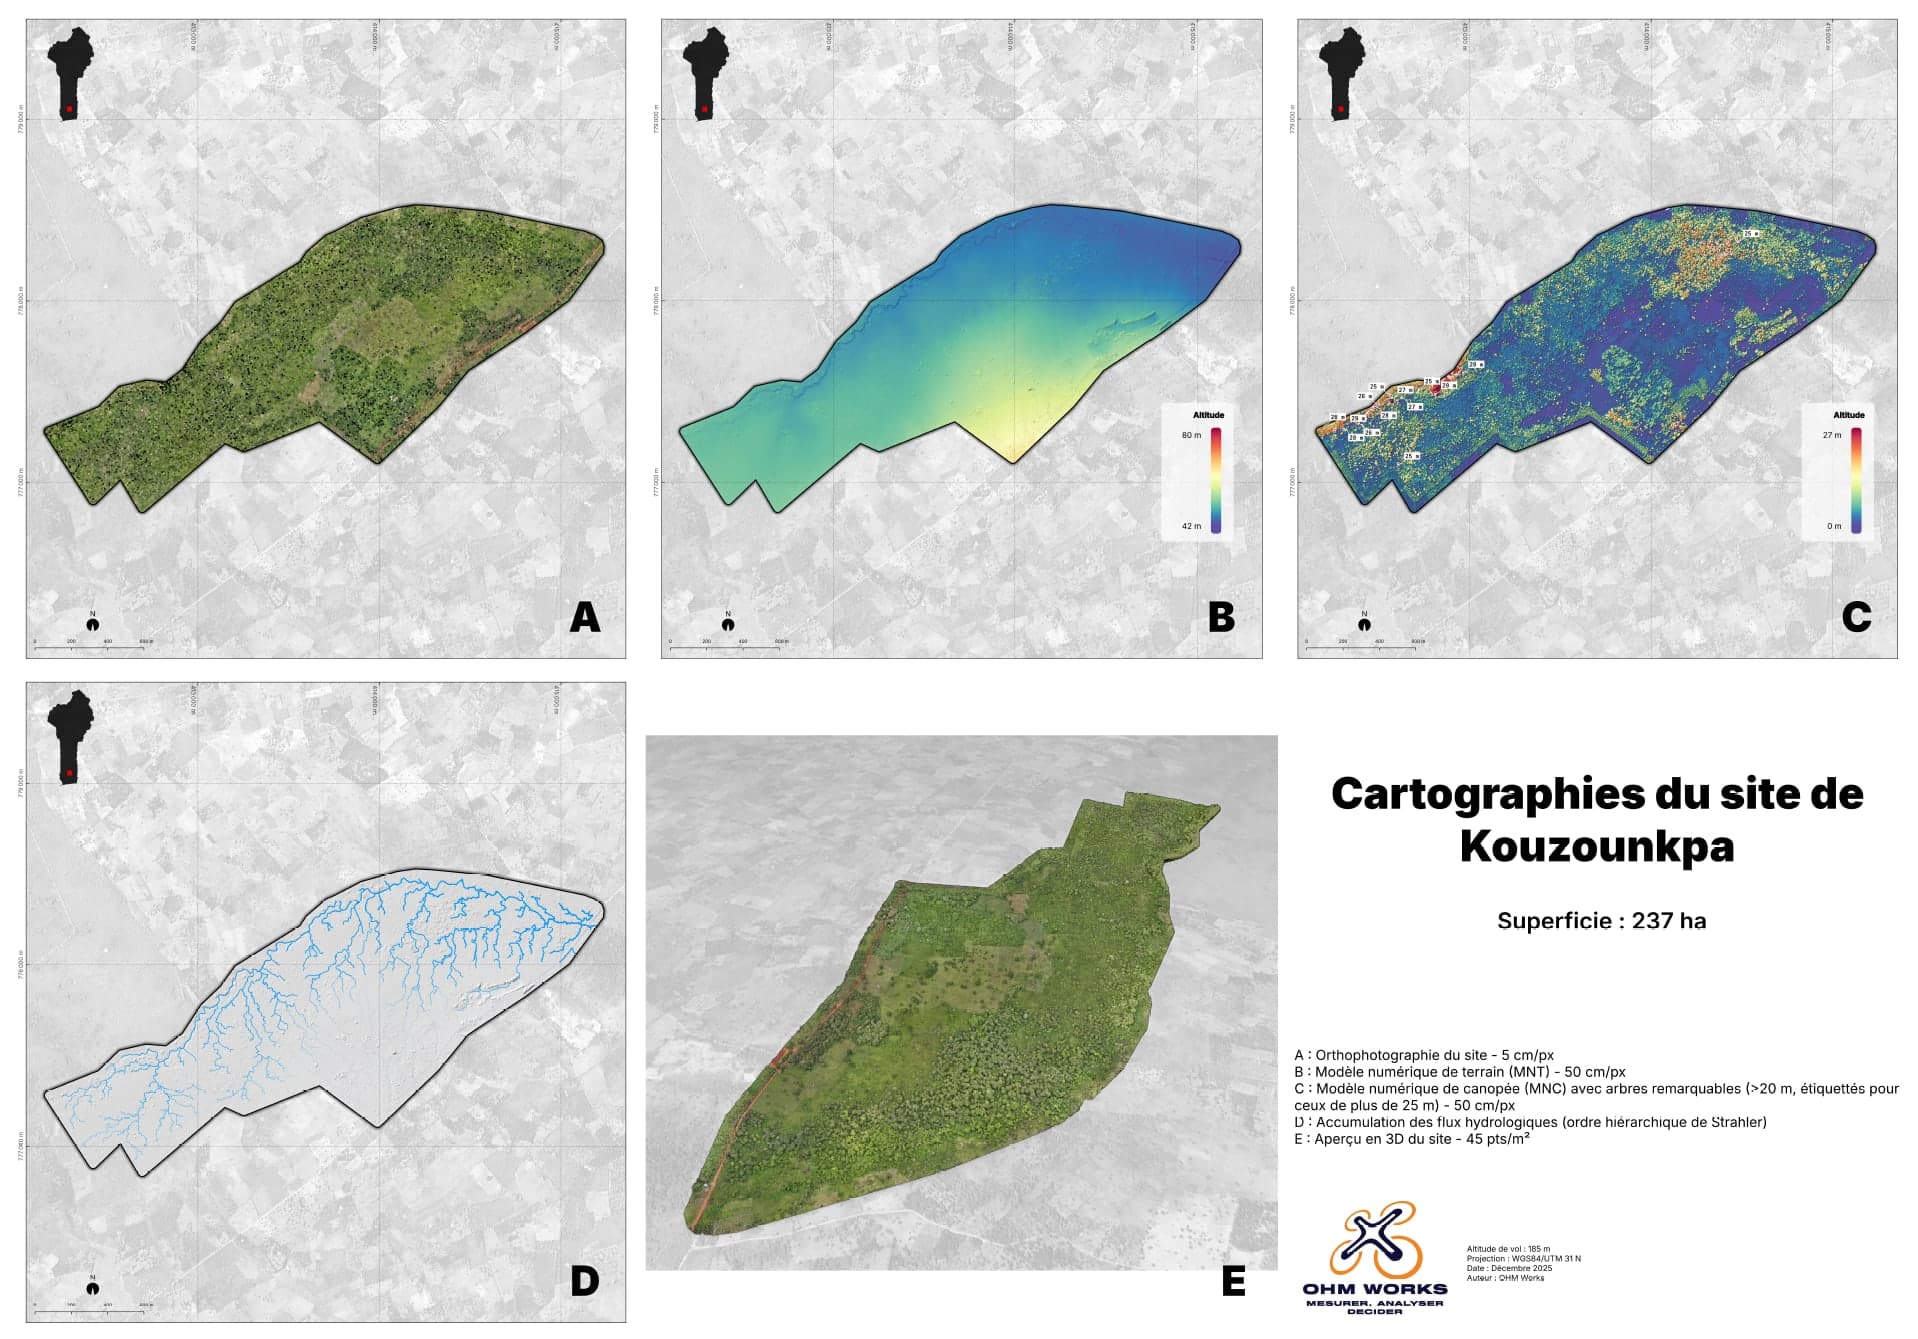
Five maps, one complete view of the site
The deliverable isn't a single file — it's a set of georeferenced maps that stack and cross-reference in QGIS, ArcGIS Pro, or any industry GIS. Each one answers a distinct operational decision.
A — A sharp aerial view of the plantation
The orthophoto serves as the visual reference. On the Kouzounkpa plantation, every clump, every track, every replanting zone, and every edge is identifiable. It's the base layer on which all the others are overlaid.
B — The ground, reconstructed under the canopy
This is the most valuable product of a LiDAR survey on a plantation, and the one that classical photogrammetry cannot deliver. Where the aerial image only sees the canopy, LiDAR sees through the vegetation and reconstructs the bare ground. The result: a faithful topographic model, used to size drains, terraces, and retention basins.
On Kouzounkpa, the model revealed that actual microtopography diverged by 1 to 2 metres from the producer's mental map on some zones — enough to explain yield disparities between plots otherwise considered equivalent.
C — Canopy height, tree by tree
Subtracting the ground model from the surface model gives the vegetation height for every square metre of the plantation. From that, standout trees (those above a reference height) are identified one by one and catalogued.
On the site, about forty shade trees were geolocated individually, mostly along edges. Their inventory (position + height) now allows arbitrage between conservation and felling as yields evolve.
D — The water flow network
From the ground model, the potential flow lines are reconstructed: where water moves during rain, where it accumulates, where it leaves the site. This is probably the most useful layer on a banana plantation, because it instantly reveals what no ground observation provides during the dry season: the hydraulic dynamics of the site.
On Kouzounkpa, this map immediately surfaced an 8-hectare low zone draining poorly downstream. The precise path of a redirection drain towards the main collector followed — a quantified, located solution ready for quoting.
E — A baseline to preserve over time
Beyond the maps, the survey produces an archivable 3D dataset that becomes the baseline reference of the plantation. On a second flight 12 or 24 months later, this baseline is what will allow precise measurement of growth, plant replacement and cover evolution. Without this initial dataset, any temporal analysis starts from scratch.
What the data changed for Agro Kue Kue
Three concrete findings, immediately actionable by the producer on delivery:
- A drainage failure identified. An 8-ha low-lying zone with insufficient downstream drainage was precisely mapped, with a directly usable layout for the remediation drain.
- An inventory of shade trees. Around forty standout trees geolocated, now integrated into the operation's GIS.
- An objective topography. Gaps between the producer's perception and the actual ground — often the cause of yield disparities — are now measured.
When LiDAR is the right call
Airborne LiDAR isn't the default solution for every plantation. On a young, spaced-row plantation, classical photogrammetry is enough (see our 60-ha field report from Alada). LiDAR becomes the right call as soon as a plantation combines two of the following three criteria:
- A dense canopy that hides the ground from above (mature banana, closed rubber, cocoa under shade trees).
- A central water stake — irrigation, drainage, watershed management, erosion control.
- Poorly known topography or terrain too flat for official cartographic maps to be useful.
On a banana plantation, two of those three criteria are almost always met. That's why the investment pays off from the very first campaign — not through tree counting, but through the precision it brings to development decisions.
Temporal monitoring as a strategic asset
The real long-term gain isn't the one-off campaign. It's the creation of a reference dataset you can return to every year. After three years of regular monitoring, you have a temporal series that allows you to:
- Measure the actual rate of plant replacement.
- Detect water-stress or plant-health zones early.
- Verify the real effectiveness of hydraulic developments.
- Build a technical dossier usable for certification or land-use disputes.
The plantation stops being an inventoried asset; it becomes a steered system, with objective data that survives team and management changes.
Ready to switch to drones?
Let's discuss your project in 30 minutes.
Firm quote within 48 hours. Coverage across Benin, West Africa and France. XY accuracy < 3 cm, volumetric tolerance ± 1 %.