
See further.Decide right.
For agriculture, OHM WORKS designed Green Brother — a drone and satellite solution tailored for West African farms, cooperatives and engineering offices. Plant counting, NDVI vigor, crop stress, deliverables in under 72 h.
- XY accuracy under 3 cm, Z under 5 cm on every survey.
- Pilots certified by ANAC Benin and DGAC France.
- Actionable analysis maps delivered within 72 h.
Applications
Plant counting
Automated, georeferenced inventory across hundreds of hectares — cashew, mango, palm, maize, market garden crops. Compares actual plant populations to planned seeding densities, pinpoints gaps and plans replanting.
Crop vigor maps
NDVI, NDRE and GNDVI indices mapped at centimetric resolution. Precisely locates zones of water stress, nutritional deficiency and vigor loss to direct fertilizer applications only where needed.
Weed detection
Identifies and quantifies weed-infested areas in-season. Generates targeted weed management prescription maps and optimizes herbicide use — only where needed, only when needed.
Yield estimation
Determines the percentage and exact location of high and low yield-potential zones. Plan harvest operations, evaluate revenue before harvest day and decide on corrective actions mid-season.
Disease and pest detection
Analyses crops at different growth stages to detect fungal diseases and pest damage early. Identifies priority treatment zones to intervene before losses spread across the whole parcel.
Plant stress and waterlogging
Rapidly and precisely locates all zones affected by water stress or waterlogging, regardless of field size or crop type. Reduces negative crop impacts and helps plan irrigation or drainage interventions.
Our method
A proven three-step protocol, from technical brief to delivery of usable data.
- 01Step 1
Brief & sensor setup
Scoping: area, crop species, target indices, growth stage and objective (initial, yield or health report). Sensor selection (RGB, 5-band multispectral, thermal) and mission planning.
- 02Step 2
Certified multispectral flight
ANAC / DGAC-certified drone, GSD 2-5 cm/pixel depending on agronomic objective. A 100 ha parcel captured in under 2 hours, with systematic radiometric calibration.
- 03Step 3
Maps & deliverable report
Vegetation index computation, parcel classification, prescription map generation and structured agronomic report (initial, yield or health) — compatible with farming GIS tools and variable-rate sprayers.
Monitoring programme
Track your crops at every growth stage
Three reports calibrated to vegetative and reproductive stages — from germination to harvest — to steer each campaign with precision.
Initial Report
- Germination rate
- Plant count
- % and weed zones
- Elevation map
- Waterlogging mapping
- Actual arable area
- Field boundary delineation
- GeoTIFF export
Yield Report
- Plant vigor
- % and weed zones
- NDVI map
- GeoTIFF export
Health Report
- Plant vigor
- NDVI maps
- Damage detection
- GeoTIFF export
Deliverables
Ready-to-use data, delivered in the formats expected by your field and design teams.
Vegetation index maps
GeoTIFFPNGNDVI, NDRE, GNDVI — stress diagnosis, deficiency zones, multi-year vigor tracking
Plant count and population report
PDFCSVKMLGeoreferenced inventory, seeding gap detection, replanting planning
High-resolution multispectral orthophoto
GeoTIFFECWParcel overview, agronomic zoning, campaign archive and inter-season comparison
Variable-rate prescription maps
SHPISO XMLModulated treatment compatible with variable-rate sprayers and farming GIS tools
Structured agronomic report
PDFInitial (germination), yield or health report depending on vegetative or reproductive growth stage
FAQ · Frequently asked
The questions we hear most often.
What is the error margin of an AI palm tree count?
Below 2 % on perennial crops with spaced rows (mature oil palm, coconut). 3 to 5 % on very dense plantations or those still closing canopy. Each detected tree is delivered with a confidence score.
Can the drone detect diseases before they become visible?
Yes, with a multispectral sensor. NDVI and NDRE indices reveal water and plant-health stress 2 to 4 weeks before symptoms appear to the naked eye. We have mapped red weevil outbreaks on date palms this way.
What deliverable formats work in QGIS or ArcGIS?
SHP, GeoJSON, GeoPackage and KML layers for palm detections and replanting zones. GeoTIFF orthophoto and CHM (Canopy Height Model) as GeoTIFF raster. Everything is georeferenced in UTM 31N by default.
Which crops does AI detection work well on?
Oil palm (excellent), coconut (very good), rubber (good before canopy closes), date palm (good). More complex on cocoa under forest shade — we then switch to LiDAR to distinguish cocoa from shade trees.
How often to re-fly to monitor a plantation?
Annually minimum to track growth and detect missing trees. Biannually on young plantations still closing canopy. Quarterly with a multispectral sensor if you monitor NDVI to optimise inputs.
Go deeper
Read the related technical article.
Agriculture · LiDAR
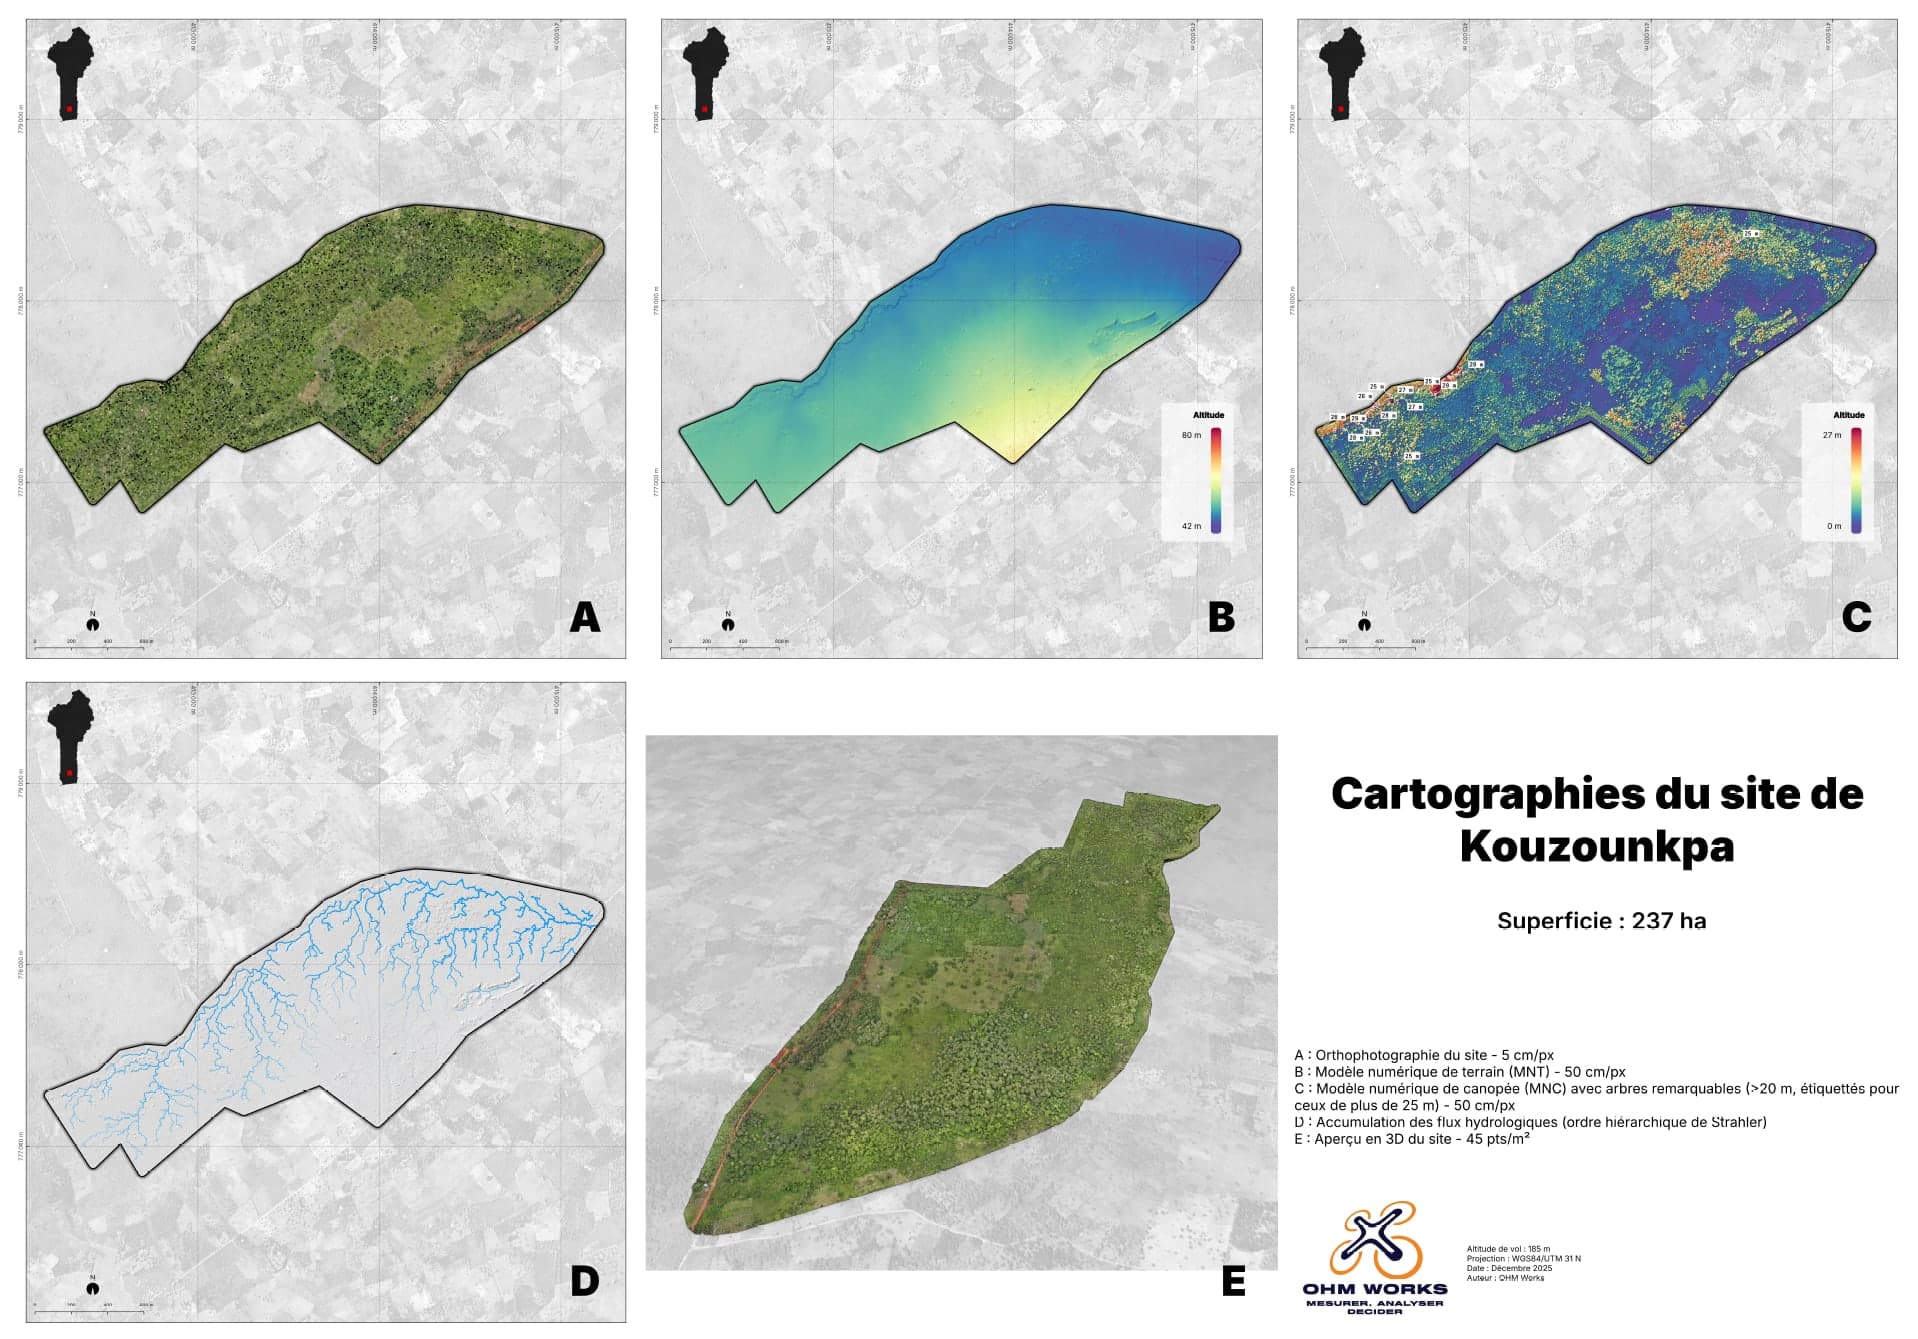
LiDAR on a 200-hectare banana plantation: what the drone brings to agriculture
On 200 hectares of banana plantation in Kouzounkpa (Benin), a single drone pass delivered a complete reading of the site — water, ground, canopy. Jargon-free field report on the Agro Kue Kue mission.