


Industry
Energy
Optimize the management and maintenance of your overhead power networks through drone LiDAR inspection. Anticipate risks, plan interventions and ensure regulatory compliance of your installations — across all overhead network types: HV, MV and LV.
- All overhead network types
- HTB · HTA · BT
- Full LiDAR 3D modeling
- LiDAR
- At-height work
- 0
Applications
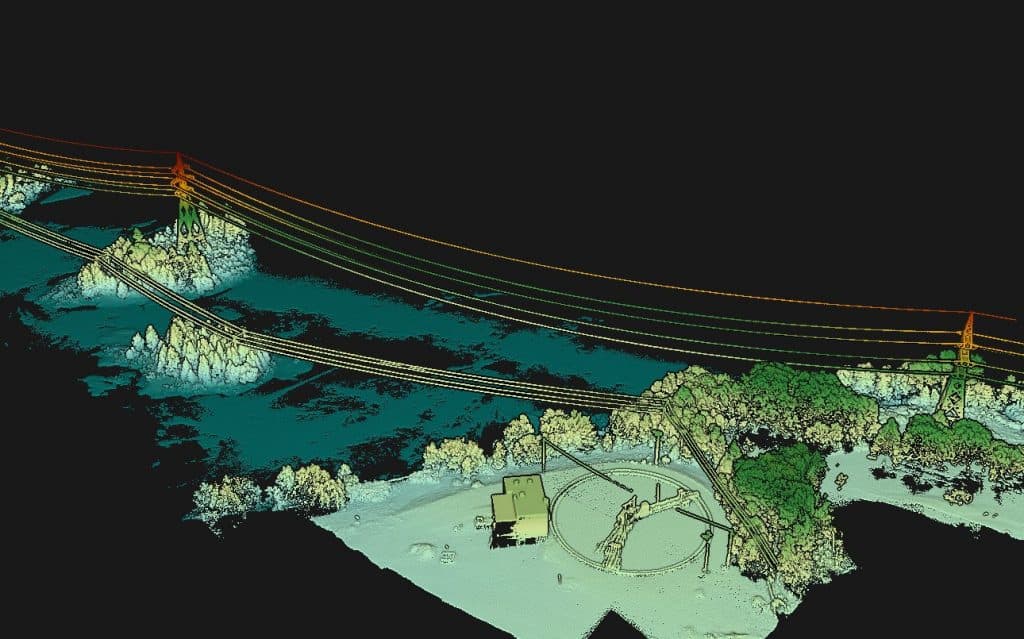
Full LiDAR 3D modeling
High-density point cloud of the entire line — cables, supports, immediate environment — for multi-parameter analysis.
Sag & ground clearance
Automatic computation of sag and minimum ground clearance, regulatory distance compliance under all conditions.
Vegetation & building clearance
Mapping of minimum distances between lines and surrounding obstacles, tree-trimming prioritization and risk identification.
Inter-conductor spacing
Accurate measurement of distances between conductors to verify electrical compliance and anticipate phase-to-phase interactions.
Hot spot thermography
Detection of hot spots on insulators, contacts and connections — anticipating failures before service interruption.
Pole & tower inspection
Structural visual audit of supports: corrosion, deformation, anchors, missing components. Per-support report.
Our method
A proven three-step protocol, from technical brief to delivery of usable data.
- 01Step 1
Brief & network analysis
Scoping: network type (HV / MV / LV), line length, outage constraints, expected deliverables (report, 3D model, measurements).
- 02Step 2
LiDAR + thermography flight
LiDAR drone + IR thermal sensor for simultaneous geometric and thermal acquisition. Coverage up to 30 km/day depending on configuration.
- 03Step 3
3D model & measurements
Point cloud classification, automatic extraction of cables and supports, sag / clearance / spacing computations, annotated thermal reports.
FAQ · Frequently asked
The questions we hear most often.
What length of high-voltage line can be inspected per day?
10 to 25 km per day depending on equipment density and terrain profile. For linears of several hundred kilometres, we plan multiple passes with simultaneous LiDAR + thermographic surveys.
How accurately do you measure cable sag?
5 to 10 cm accuracy on the sag of an HV cable. LiDAR captures the real position of the loaded cable, we compute the gap to theoretical sag and detect abnormal spacing between conductors.
Do you detect dangerous trees in the clearance corridor?
Yes. The CHM (Canopy Height Model) from LiDAR identifies each tree in the right-of-way corridor, computes the distance to the nearest cable and flags those exceeding the regulatory safety zone.
Does aerial thermography replace ground inspection?
For regular audits, yes. For curative work (insulator replacement, connection refit), a ground team remains needed — but the drone identifies precisely where and what to intervene on, which divides intervention time.
What deliverables for a complete HTB feeder audit?
Classified LiDAR point cloud, cross-section and longitudinal profiles, sag computation per span, thermal hotspot mapping, geolocated component inventory, anomaly-by-anomaly PDF report with intervention prioritisation.
Go deeper
Read the related technical article.

Technology · LiDAR
Airborne LiDAR in Benin: how it actually works
LiDAR penetrates the canopy, reconstructs the bare ground and models structures with centimetre accuracy — no climbing, no clearing. Here's how OHM WORKS runs the sensor on Beninese sites.